| http://fos.bath.ac.uk/vas/papers/CAADFutures97/ | rights of reproduction on request V.Bourdakis@bath.ac.uk |
Centre for Advanced Studies in Architecture (CASA)
(Paper presented in CAADFutures97 4-6th August 1997)
The presentation slides are also available here.
Large-scale, three dimensional, interactive computer models of cities are becoming feasible making it possible to test their suitability as a visualisation tool for the design and planning process, for data visualisation where socio-economic and physical data can be mapped on to the 3D form of the city and as an urban information repository. The CASA developed models of the City of Bath and London’s West End in VRML format, are used as examples to illustrate the problems arising. The aim of this paper is to reflect on key issues related to interaction within urban models, data mapping techniques and appropriate metaphors for presenting information.
Keywords: urban modelling, virtual environments, navigation, data mapping, VRML.
With the recent developments in computers, in terms of raw power and graphics hardware performance as well as new software technologies, we experience a switch in architectural visualisations from still images and pre-rendered animations to interactive three dimensional (3D) models and Virtual Reality (VR). VR is developing on a fast pace and, as more and more people are acquainted with the new generations of computer games and their capabilities, expectations are growing. VR developments over the last 4-5 years in many ways resembles the CAAD anticipated development over the 60ies and 70ies only the latter took a few decades to materialise¾ and to date has still not satisfied all visionaries. We have now a situation where the technology is available, has been applied successfully in other fields (aeronautical, automotive, chemical engineering etc.) and it is mainly a matter of finding ways to use it, as opposed to arguing what the technology can /should do and then trying to materialise it (Negroponte, 1971). However, applying 3D modelling techniques in order to create interactive computer models of cities is still a rare phenomenon mostly due to resources limitations and, to a lesser extend, doubts on its utility.
Two years ago in the last CAAD Futures conference, Day et al (1995), reporting on the Centre for Advanced Studies in Architecture (CASA) work at the time, explained that the urban models developed are a means to exploring issues on urban design, a test-bed for new theories and practices. At that time, technology was the main limiting factor; rendering an image of the Bath city model would take at least twelve hours on a single computer. The author is currently using an interactive version of the Bath city model where an image is rendered in a fraction of a second¾ the possibilities for exploring the city are immense. This enables the development and testing of new theories as well as the creation of urban models not only as interactive urban planning and design tools but as front end to a series of underlying databases. Furthermore, developments on the Internet, enable fast communications and distribution of digital urban models, facilitating tele-working and teleconferencing for the evaluation process as well as training and education.
As the problems governing this new medium are quite different to classic CAD ones, we should grasp them the sooner possible if we are to create successful, compelling VE that can be useful to both research and practice. In this paper, issues related to interaction within urban models are considered and data mapping techniques are discussed together with some appropriate metaphors for presenting information.
CASA has been involved in 3D computer modelling for the last six years. In 1991 CASA received a grant to construct a 3D computer model of Bath. The model was constructed in order to assist in making the planning and development control process more democratic by providing a means by which proposals could be visualised and alternative schemes for a site compared. In addition to its use in development control, the model has also been used to widen the public debate on how the city should develop in the future. The model was created from aerial photographs of the city in 1:1250 scale using a stereo digitiser. It is accurate to 0.5 metre and covers the whole historic city centre, an approximate area of 2.5x3.0 km along with the landform of the Avon valley covering a total area of 10km x 10km. During 1995 and using similar techniques, the core of London’s West End covering 1.0X0.5km was modelled in similar accuracy but on a lower level of detail. It was initially used for transmitters’ signal propagation experiments by British Telecom (BT); CASA has been using it as a test-bed to navigation and mapping information research. Throughout the models’ construction, commercially available software has been used wherever possible with in-house applications being limited to program customisation (Bourdakis et al, 1997).
Two years ago, the London’s West End 3D model was tested against the then new Virtual Reality Modelling Language (VRML) and an online version of it was created¾ the Map of the Future (Bourdakis, 1996). Following, the much larger Bath city model was imported into VRML. One of the initial concerns was how VR technologies and VRML in particular would scale and adopt to the visualisation of a whole city. So far, many small VR models exist, but not any at this scale. The Bath city model database is, to our knowledge, the largest and most detailed one produced as yet; the UCLA Dept. of Architecture and Urban Design (AUD) is currently building a model of the entire Los Angeles basin covering an area in excess of 10000 square miles as part of "The Virtual World Data Server Project" which is still under construction. Cybercity’s model of Berlin is another large application of VR focusing on urban planning. However it seems that most VR urban models currently available are commercially rather than research driven (Virtual Soma, Virtual Derby, Bigbook etc.). As a consequence, the level of detail is quite low, since the focus is not on architectural features and accuracy but in simply recreating a recognisable and commercially viable image of the city. In this paper, the commercial feasibility of the issues discussed and analysed is not considered; after all, commercially viable solutions will eventually find their way into products.
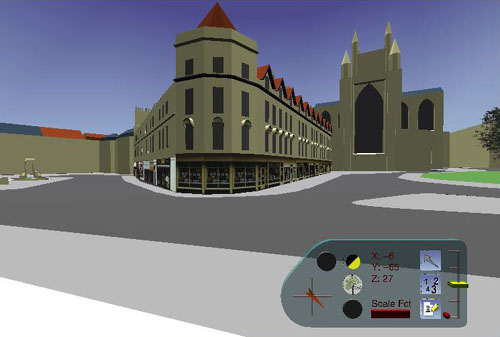
Figure 1. Bath City VRML Model
Digital models can be accurate on small scale 3D objects but do not easily scale up to the size of an urban model. There are indeed many different ways of structuring and creating a 3D computer model (be it a chair, the interior of a room, a building, a hotel complex or a whole city) however, using the engineering approach to layering (BS-1192) or Constructive Solid Geometry (CSG) modelling techniques are definitely not the right ones. Most problems are caused by the fact that VR databases are conceptually completely different to the CAD ones that engineers are used to. In many ways, VR databases are closer to the way architects work by reducing levels of uncertainty and improving understanding of the project in the design stage (Brawne, 1992) but far away from the way CAD programs usually force us to work. CAD databases can be extremely helpful in designing and constructing an architectural project, but they are quite problematic when used unmodified in a VR system.
As Negroponte (1995) explains, the whole world around us is analogue, nothing alternates from black to white or on to off and as such changes are continuous. Simulating such physical, continuous phenomena on a computer generated and maintained digital environment is difficult and in certain cases impossible. Therefore, designers and researchers have to resort to various tricks/techniques in order to create/imitate this continuity of the real world. One of the most important techniques is the use of levels of detail (LOD) to represent the same object with increasing detail to match the viewer to object distance. The overall breakdown of the urban model into entities (usually based on physical urban blocks) and the use of photographs to enhance the images created is another technique employed. Billboards are used to replace high polygon count representations of trees, humans and inanimate street furniture. Finally, instances are applied to reduce the file sizes and thus transmission times across networks. Since the structure of VR urban models is not the focus of this paper, the above techniques are not analysed any further; in depth analysis can be found elsewhere (Bourdakis, 1996).
We are still a long way from Gibsonian states of hardware where a pair of glasses is a complete VR experience carrying a database of a whole city (Gibson, 1994) and even longer away from hardware devices interacting directly with the human brain turning us into cyberorgs (as pictured on the 1983 Trumbull film "Brainstorm"). However, a properly constructed digital urban database will be suitable for such devices when they become available. With the advents in nano-technology (as demonstrated both in sci-fi, cyberpunk culture and real world) an Infinite Reality SGI computer will probably be the size of a portable CD player in a few years time (although undoubtedly not as affordable as a CD player), expanding the availability and usability of urban VR systems. In a few years time, engineers could well be working on site seeing what is proposed (super-imposing it on VR glasses) and even editing and feeding back their comments to the designers in the office.
In the following section, the issues of navigation, modes of interaction (immersive, non-immersive) and interface design are discussed.
Early in the process of creating urban VR models in CASA, the problem of navigation was identified not only with occasional users of the models but with the creators as well which made the whole issue alarming. The main problem in exploring and navigating within digital urban models is orienting oneself. This means being able to identify areas, streets, buildings. In other words making the virtual environment (VE) recognisable. There is a great difference between aiming for a recognisable VE and pursuing realism ¾ the former does not focus on imitating reality (Carr et al, 1995). Creating realistic VE of such scale is still not feasible and in many cases both pointless and inappropriate.
In real life, when a person becomes disoriented in an urban environment, the natural action taken is to scan the surroundings for information. As Lynch (1960) explains, there is a consistent use and organisation of definite sensory cues from the external environment into a mental map. It seems that in virtual environments many problems occur due to users not understanding the rules of movement. As a result the provision of a simple, easy-to-learn navigation solution (Hughes, 1995) is exceedingly important for the user.
Computer games development is a field that one can review various design decisions; a very efficient, competitive environment enforcing quick development cycles. Tomb Raider by EIDOS Interactive, seems to epitomise the developments in navigation techniques employed by the games industry. Here, the player’s avatar is fully included in the VE. The player is not a spaceship dashboard or a weapon carrying hand anymore but a fully articulated avatar giving better sense of scale and participation (Gibson, 1986). Real time rendered texture mapped animated characters are used in collision detection and gravity aware environments. The most interesting feature is the Director’s Camera Movement where the camera zooms and moves around the action (that is the player’s avatar) creating a feeling of a well directed action movie rather than a simple game playing. Wandering in the rooms becomes a worthwhile experience itself! The scale issue addressed with the full avatar presence is the most notable improvement along with the use of perspective and camera movement to follow the action.
VR software employ a series of navigation metaphors; the three main ones are walk, fly and examine. (Wernecke, 1994). The examine mode enables the spinning of objects in order to study them from all possible viewing positions. Within an urban model this is hardly a suitable navigation metaphor; for example, there is a very limited need for underground camera positions (mapping the city’s infrastructure, services channels, etc.). The walk metaphor is the ideal navigation metaphor, being the closest one to the way people interact with the environment in real life. However, due to the lack of sufficient detail at street level, the "identity" and "structure" of a digital urban image is much "stronger" from an elevated position¾ when more distant cues are visible. This especially applies to the aerial photograph based CASA models. Therefore, the work carried out in CASA’s focuses to a great extend on the flying mode of navigation.
Among the problems linked to the fly navigation mode is that it effectively removes any degree of immersion by switching the person to map reading mode. It can be even argued that it defies the reason of having a VE in the first place. According to Ihde (1993) there is evidence that there are important connections between the bodily-sensory perception, cultural perceptions and the use of maps as a navigational aid. He relates the bird’s eye view of flying over a VE to the God’s eye map projection identified in the literary cultures. The fly mode of interaction has definite advantages although it also introduces an often unknown perspective of the city. This perspective seems more comprehensible to engineers and architects who are used to working with scale models of sites which inherently introduce the bird’s eye view.
According to Slater et al (1995a), an immersive system is one that is capable of delivering varying degrees of "...inclusive, extensive, surrounding and vivid illusion of reality to the senses of a human participant". A higher level of inclusive and surrounding illusion can be created using head mounted displays (HMD) which "block" the real world and data gloves that enable greater flexibility and input range. Vividness is affected by the actual quality of the image projected and as such is not clearly related to the hardware interface mechanisms but more to the underlying software. Hardware tracking head movement and even iris movement, enhance immersion by closely matching participant’s proprioceptive feedback with body movements. Probably the ultimate immersive system is the one demonstrated in the 1995 cyberpunk film by Cameron, "Strange Days"; a hardware device that clamps over the skull, interfacing with the brain directly, without the need for headsets, loudspeakers, tactile feedback mechanisms etc.
Projection VR is another immersive system, improving the illusion created by the surrounding environment. Users do not wear helmets, but lightweight stereo polarised glasses while they move inside a large cube made out of display screens (CAVE). Again, body tracking mechanisms are used for navigation within the environment.
Desktop VR on the other hand employs a computer screen, a preferably high degree of freedom input device and if possible spatialised sound. Due to CASA’s architectural 3D modelling background and the focus of the research on planning evaluation, it was decided to adopt a desktop VR approach. It is also believed that since we are still in the early stages of development, immersiveness is not crucial and furthermore can be achieved in the future without having to re-structure the digital urban databases currently under development.
Among the problems identified in early observations in CASA, was the lack of the concept of time and distance. Walking on the streets of a virtual city is an effortless exercise in contrast to the real experience. It is possible to fly over or walk across a whole city model in a matter of seconds and that can be instrumental on loosing orientation. It is therefore interesting to note a few recent attempts in immersive VE which introduce body interfaces to navigation. Shaw (1994) used a bicycle as the metaphor for navigating in his installation The Legible City, whereas Slater et al (1995b) used a "walking on the spot" metaphor. Finally, Davies (1996) has created a synthetic environment called "Osmose" exploring the relationship between exterior nature and interior self where the immersant’s body movements are triggering events that position their body within the VE.
The very first technique employed in CASA in order to enhance sensory cues from the VE was to increase the field of view. This technique has been successful in architectural photography, where the author rarely uses anything but a 20mm lens on a 35mm SLR camera, giving a field of view close to 90 degrees. However, the results of a small case study with students of architecture and others where discouraging. Among the users tested, architects identified the problem as being that of "wrong perspective" compressing the depth of the image and generally creating a "false" image of the city. Others could not easily identify the problem but found the environment confusing nevertheless. Consequently, it was decided to use only the "normal" lens on all VR projects although it does limit the perceived field of view which in real life is much higher than 45 degrees. Experiments on level of detail degradation in the periphery of HMDs (Watson, 1995) demonstrate that more efficient VR interfaces can be achieved (compared to non-immersive ones) without necessarily hitting on the main VR problem; CPU capabilities.
Another problem faced in non-immersive VR is that of the direction of movement versus direction of sight. Due to the two dimensionality of the majority of input devices used in non-immersive VR, it is assumed that the user looks at the exact direction of the movement. This is true in many cases but while investigating a new environment, movement and direction of viewing should be dealt as two individual variables. Immersive VR headsets with position and orientation tracking mechanisms are again the easiest and more intuitive solution to this problem only matched by high quality joysticks and some home-brew solutions (Hollands, 1996).
Navigation is by no means the only activity catered for in urban VE. Interacting with elements of the VE, editing buildings, inserting objects etc. are all essential features of an interactive planning tool. Having decided to take the desktop approach to VR, the interface design follows similar concepts. Typical human computer interface (HCI) design often implies that the fastest way to achieve a particular task (assuming you are proficient with the tools available) is a cryptic, complex, highly personalised set of commands (Negroponte, 1971). Users are forced to tune the way they think and work according to the tools available, whereas it should really be the other way round. It was therefore decided that CASA’s work would follow Hughes (1995) recommendation and "keep it simple".
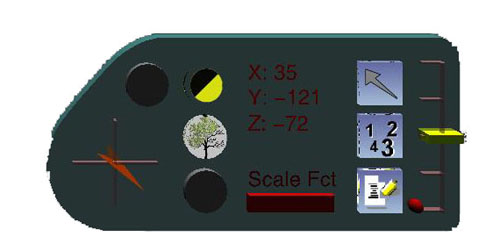
Figure 2. Bath Model Control Panel
A dashboard (Figure 2) made out of 3D elements (buttons, scroll bars, etc.) and 2D ones (compass, text, images) was developed and placed on the lower right corner of the VE display screen. This method is best suited to desktop VR systems but should not cause problems in an immersive setup. The elements within the dashboard can be classified in 2 distinct groups; the informative or feedback ones and the actions. The compass on the far left and the X, Y and Z co-ordinates of the avatar’s position together with the height and scale fields are informative. Buttons simulating seasons and lighting, toggling alternative schemes for a site, inserting trees and other elements and dynamically altering properties of existing urban elements are actions. Some of the actions are exclusively carried out in the dashboard, however, inserting objects and moving them within the VE is done by directly manipulating the VE. Links to urban related information are achieved by direct interaction with the VE; moving the cursor over a building reports its address point while selecting a building triggers links to internal as well as external databases. Finally reports with positions of new elements inserted and modifications on existing ones can be created as a record of the editing session and as a feedback to the designer of a particular scheme.
Over the years, theoreticians and researchers claimed that digital models could be used amongst others for information visualisation: "Since computers have been the most important instrument in creating a new system of cartography for weather, in studying DNA, in mapping atomic surfaces and subattomic particles, and especially in enabling the visual maps that explore chaos theory, then why not hope this juxtaposition of masses of visual information and high-tech appliances will produce a new map for the city and for architecture, a map that will describe non random order suddenly appearing in the midst of seeming disorder?" (Boyer, 1996). However, using an 3D digital urban model for mapping and visualising information is an entirely different process to urban planning and evaluation implying a different approach to structuring, organising and visualising digital urban models. The points of what can be mapped on an urban model, how it can be mapped, how accessible is the information and whether it is worth the effort are addressed in the following sections. The whole issue closely relates to the field of Geographic Information Systems (GIS) where software solutions, based on 2D and 3D maps, have been developed since the late 60ies.
Data mapped on a digital urban model can be generally classified as either static or dynamic. Among the former are all census data, land use and value, crime rate etc. Engineering services and facility management are also included in this category together with business directories and services similar to A-Z directories. Finally, historic and tourist data sum up the static data that can be mapped on an urban model. Dynamic data imply a real time (or at least near real time) stream of data from various sensors placed in the physical environment. Traffic and pollution together with temperature and energy consumption can be considered dynamic (although in most cases they will be treated as static). Information related to safety and security management are the most typical dynamic data forms.
Following the above classification, there is a real question as to whether it is important or indeed useful to map information dynamically on a digital 3D model. It has been argued that such a technique gives a better overview of the data, but the same can be true on a pre-rendered animation of similar data. Dynamic implies that the visualisation will be used for decision making and action taking in real time, else it defies the reason of having dynamic data mapped in the first place. Out of the data types listed above, traffic, safety and security are the only ones that would genuinely benefit from a dynamic organisation. A VR traffic model could be used and linked to the computers controlling traffic lights within the city or integrated to a security model utilising Global Positioning Systems (GPS) to monitor the position of emergency or other selected vehicles within the city. Following, closed circuit television (CCTV) remotely operated from within the VR model could feedback live video of the real city to the control room and facilitate decision making and navigation.
Tomas (1991, p.35) claims that "The ‘abstract representation of the relationships between data systems’ in cyberspace is, however, highly plastic, and can take any form ranging from pure geometric color-coded copyrighted shapes or architectural representations signifying corporate ownership to ‘photo-realistic’ illusions. Such sites are the essence of a postindustrial society-pure information duplicated in metasocial form: a global information economy articulated as a metropolis of bright data constructs, whose plasticity is governed by a Euclidean model based on a given problematic of visualising data, a problematic subordinated, in Gibsonian cyberspace, to the dictates of a transnational computer-based economy".
The two main issues related to mapping information on a digital urban model are the model’s physical entities on which data will be mapped and data granularity. Regarding the former, the geometric properties of the data mapped and their appearance are considered. Starting with, the easiest way to map information is by using colours or patterns on the existing urban forms. This can be done on either a 2D or 3D basis. The next possible way, is to map information onto the third dimension¾ height¾ altering it according to the data values. Mapping more than one variable in the same urban representation can be achieved by combining colour or patterns with 3D height mapping. Finally, constructing new geometrical shapes, either deriving from the existing urban structure or abstract as in Space Syntax maps (Hillier, 1996) is another way to map data onto a digital urban model. It should be noted that there are data types better suited to colouring (such as categories) whereas height is more suited to ranked and continuous numeric data.
Data granularity determines the breakdown of the digital model into data primitives. Assuming an almost infinite amount of information, unit sized cubes can be used—cube size dictated by data volume and detail. Alternatively, the building borders can be used as the geometrical entities for data mapping. In certain cases, property borders can be considered instead. When the amount of data available is small, whole building rows can be used instead. Finally, the urban block contour and the streets can be utilised for census data mapping (Figure 3). The whole issue is a function of data breakdown and quantity versus urban LOD.
Using the Z axis—height—to map data within the urban model alters the image of the city upsetting the mental image of the city that the visitor/viewer possesses. In order to reduce the effects of this phenomenon, an abstract city form representation is often more appropriate where certain elements of the city may be better omitted. It should be generally attempted to use the 3D digital model as a 2D map (no ground undulations, building heights etc) where data are mapped on the 3rd axis (Z) (Wen, 1995) without attempting to imitate the actual city image. However by doing so, landmarks may not be as prominent as in real life, may be obstructed by disproportionally extruded buildings or may even be completely removed, hindering orientation and creating navigation problems similar to the ones described earlier. Subsequently, name tagging and textual information of addresses, street names etc. can be employed to improve navigation. Alternating screens between the abstract data urban model and the "real" urban VR model, running the two models in parallel, or employing aerial oblique view video of the area as a support tool (Shiffer, 1995) may also help in way finding and interacting with the data model.
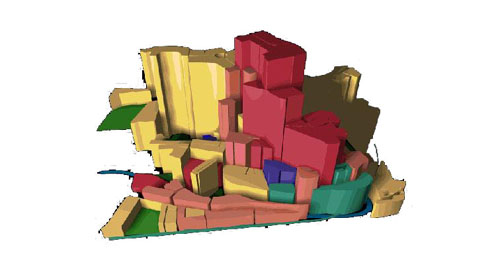
Figure 3. Land use and value in the Bath model
A flexible solution to the data mapping problem is to use a series of unit cubes arrayed so that they cover the whole city (Figure 4). Each cube is named and addressable with the two main variables of colour and height accessible to external databases. Such databases can manipulate the two main variables and thus create various representations of available data. Furthermore, it is abstract enough to produce urban models of different granularity (LOD) by combining units to match the type of data mapped. Cube size in plan may vary according to the level of detail needed, the resources available and the size, resolution and flexibility of the underlying database¾ typically ranging from one metre to five or even ten. However this solution is not without weaknesses. The image of the city created is distorted and may end up as being incomprehensible especially if units are grouped together. The whole approach implies a GIS like structured approach where data are stored in a database and according to a set of rules, different representations are created, limiting the portability of the developed digital model.
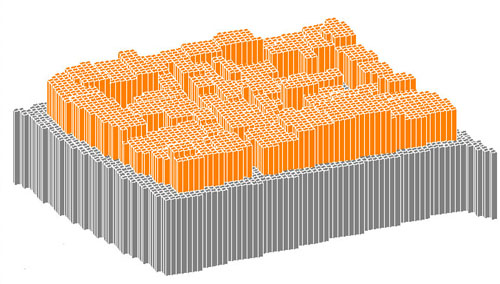
Figure 4. Unit mapping on part of the Bath model
Another shortcoming of the unit cube approach is that the resulting model is orders of magnitude larger than the original VR model. A way around this problem is to increase the level of abstraction in the digital model structure, leading to a lightweight version of the above concept where each property is modelled as an individual entity irrespective of the size, proportions and positioning of the actual building within it making it also suitable for a greater range of data.
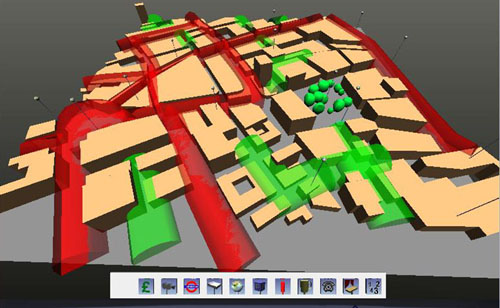
Figure 5. Pollution on the Map of the Future
As Calvino (1996) demonstrates in the Invisible Cities, events can be reduced to abstract patterns facilitating the procedures of logical operations (in Boyer, 1995). This can be expressed by a completely new abstract way of representing the city as a series of "links" or wires where information flows and data can be mapped. Alternatively and more conventionally, the same can be modelled as data tubes of varying diameters, colour and translucency where each of the aforementioned properties relates to individual data sources (Figure 5).
"The technology that delivers immense bundles of data does not simultaneously deliver a reason for accumulating so much information, nor a way for the user to order and make sense of it... The pressing challenge of multimedia design is to transform information into usable and useful knowledge" (Friedlander, 1995). As Boyer (1996) explains, arrays of information and knowledge is not the same, "Information is merely data, devoid of an abstract processing framework that can make comparisons, draw connections, recognize exemplars, and set and accomplish goals". There is however a general belief that a VR approach to the subject is beneficial mainly by extrapolating from other applications of VR technology.
It is still early to draw conclusions, after all most attempts are still experimental and fairly primitive. However, employing an Internet based, hypertexted visualisation system, such as the one used in the Map of the Future (Figure 6), data are compatible across platforms and computer operating systems making it a true global solution. Furthermore, such a system is easy to use without introducing more interface/interaction metaphors. In the Map of the Future, an HTML/VRML interface, utilises a textual based pane at the left hand side, where all the queries from either the control panel or the VR model itself are directed. This way, all visualisation takes place on the top right pane with navigation on the right hand side panes (both the VR and the control ones).
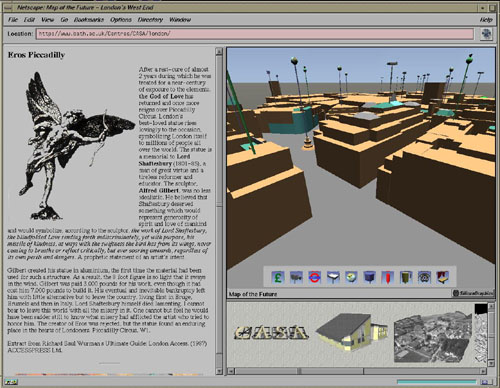
Figure 6. Multi-windowed display of the Map of the Future
Using the Internet, databases can be distributed and used around the globe without the need for expensive software solutions. This can be a serious consideration in large collaborative projects. On the other hand the limited security provided by the Internet (although improved lately) has to be considered very carefully. Concluding, using digital 3D urban models data are presented in ways that are more comprehensible than the typical spreadsheet or 2D coloured map. Furthermore, multiple data sources may be mapped more intuitively in a digital 3D model.
We should not fall in the trap of technological development by using new technology just for the sake of using it. There are quite a few drawbacks in using a VR system for data visualisation. In this section, the limitations of conventional systems (be it GIS or simple 2D maps) are presented and compared to the ones of VR systems described in the previous sections.
Among the main limitations of using 2D maps is that relationships and comparisons between data is difficult to both model and visualise leading to substantial replication and repetition in the effort involved. Furthermore, the data mapped and presented are mainly static, the only exception been in computer animated live feeds of data that may modify colours. There is also a important semantic differentiation between the data and visualisation since the database and visual representation are two distinct linked functions whereas in VR environments (and VRML in particular) the database is the visualisation. Finally, it is difficult to relate to other information—a diagram visualising crime rate will neither let you pinpoint the address of a property (unless it is a GIS database) nor compare crime rate with land value or use.
The freedom of movement within the data is a major feature of a VR based system. It is possible to experience the data from different viewpoints, camera angles, heights creating a more inclusive map of the information involved. The drawbacks of the fly navigation mode turn into advantages when large amounts of abstract data are visualised. The lack of scale limitations of the data mapped is also extremely beneficial. One can zoom into an area, get a higher resolution representation and still move back and have an overview of the whole area using familiar metaphors. It is possible to assess and model relationships between seemingly unrelated data sets making it a more suitable research and teaching tool. Finally, it is easier to dynamically alter the data feed and thus have a more real time experience presenting live information on the city making it highly appropriate for certain types of data—temperature, pollution, traffic, shadow calculations mapping etc.
The disadvantages of employing VR systems for data mapping and visualisation are limited to that of decision making on the appropriate data and suitable data resolution. Potential problems due to abstract 3D representations of cities must be also considered.
Large scale 3D computer urban models highlight a series of shortcomings in existing technology and most important in theory and research. Navigation is the topic better covered in past research and it seems that a combination of fly mode with suitable interaction metaphors is providing a satisfactory solution. Controlling events within the VE can be dealt with using onboard control panels. However, data mapping and visualisation is still an area in need of further research.
It is essential to identify the types of data suitable for 3D VR representation. Dynamic datasets are suited to VR urban models much more than conventional static ones. Finally, one must be careful and critical in deciding on abstraction levels to match the data types mapped. Failing to achieve the right balance, leads to digital urban models that are either too detailed for the information mapped (i.e. resources wasted in modelling and visualisation) or too coarse to map accurately the available data.
Overall, digital versions of our cities are extremely useful and are starting to enable seamless integration in the design and evaluation stages, the planning and finally the education of researchers and the public in general.
Vassilis Bourdakis is an architect, completed a PhD at Bath University and is currently working on virtual reality systems for urban design.
Bourdakis, V. and Day, A. (1997) The VRML Model of the City of Bath, Proceedings of the Sixth International EuropIA Conference, europia Productions.
Bourdakis, V. (1996) From CAAD to VRML: London Case Study, The 3rd UK VRSIG Conference; Full Paper Proceedings, De Montfort University.
Brawne, M. (1992) From Idea to Building ; Issues in Architecture. Butterworth Architecture.
Boyer, C.M. (1996) Cyber cities; Visual Perception in the Age of Electronic Communication Princeton Architectural Press.
Calvino, I. (1996) Invisible Cities Translated from Italian by W. Weaver (First published in Italian, 1972) Secker & Warburg. London.
Carr, K. and England, R. (1995) Simulated and Virtual Realities: Elements of Perception. Taylor and Francis, London.
Charitos, D. (1996) Defining Existential Space in Virtual Environments In: Virtual Reality World96 Proceedings.
Charitos, D. and Rutherford, P. (1997) Ways of aiding navigation in VRML worlds Proceedings of the Sixth International EuropIA Conference, europia Productions.
Davies, C. and Harrison, J. (1996) Osmose: Towards Broadening the Aesthetics of Virtual Reality, ACM Computer Graphics: Virtual Reality (Volume 30, Number 4).
Day, A., Bourdakis, V. and Robson, J. (1996) Living with a Virtual City In Architectural Research Quarterly, Vol2, pp.84-91.
Day, A. and Radford, A. (1995) Imaging Change: The Computer City Model as a Laboratory for Urban Design Research In: CAAD Futures 95, Papers received Volume 2. National University of Singapore.
Friedlander, L. (1995) Space of Experience: On designing Multimedia Applications. In: Contextual Media: multimedia and interpretation E. Barrett and M. Redmond (eds). MIT Press
Gibson, J.J. (1986) The Ecological Approach to Visual Perception. London
Gibson, W. (1994) Virtual Light Penguin Books
Graham, C. Data Visualisation and VRML http://www.best.com/~cyber23/virarch/article.html
Heim, M. (1995) The Design of Virtual Reality In: Cyberspace/Cyberbodies/Cyberpunk; Cultures of Technological Embodiment M. Featherstone & R. Burrows (eds). Sage, London
Hillier, B. (1996) Space is the machine: a configurational theory of architecture Cambridge University Press.
Hollands, R. (1996) The Virtual Reality Homebrewer’s Handbook John Wiley & Sons.
Hughes, K. (1995) From Webspace to Cyberspace Enterprise Integration Technologies (EIT) Version 1.1 http://www.eit.com/~kevinh/writings/cspace/
Ihde, D (1993) Postphenomenology, North Western University Press, Minnesota.
Lynch, K. (1960) The image of the city MIT Press, Cambridge, Mass.
Mitchell, W.J. (1996) City of Bits. MIT Press.
Negroponte, N. (1971) The architecture machine MIT Press.
Negroponte, N. (1995) Being Digital. Hodder and Stoughton, London.
Shaw, J. (1994) Keeping Fit, @Home Conference, Doors of Perception 2, Netherlands Design Institute, Amsterdam.
Shiffer, M.J. (1995) Multimedia Representational Aids in Urban Planning Support Systems In: Understanding Images; Finding Meaning in Digital Imagery, F.T. Marchese (ed) TELOS.
Slater, M. and Wilbur, S. (1995a) Through the Looking Glass World of Presence: A Framework for Immersive Virtual Environments In Framework for Immersive Virtual Environments FIVE’95 Esprit Working Group 9122, QMW University London.
Slater, M., Usoh, M. and Steed, A. (1995b) Taking Steps: The Influence of a Walking Metaphor on Presence in Virtual Reality, ACM Transactions on Computer-Human-Interaction (TOCHI) Vol.2, No3.
Tomas, D. (1991) Old Rituals for New Space: Rites de Passage and William Gibson’s Cultural Model of Cyberspace In: Cyberspace: First Steps M. Benedikt (ed). MIT Press
Wen, J. (1995) Exploiting Orthogonality in Three Dimensional Graphics for Visualizing Abstract Data. Department of Computer Science Report CS-95-20, Brown University.
Watson, B., Walker, N. and Hodges, L.F. (1995) A User Study Evaluating Level of Detail Degradation in the Periphery of Head-Mounted Displays In Framework for Immersive Virtual Environments FIVE’95 Esprit Working Group 9122, QMW University London.
Wernecke, J. (1994) The Inventor Mentor: programming Object-oriented 3D graphics with Open Inventor, release 2 Addison Wesley
World Wide Web resources referenced in the text:
CASA http://www.bath.ac.uk/Centres/CASA/
VRML2 Spec http://vag.vrml.org/VRML97/
Berlin http://www.artcom.de/projects/stpl/WWWpaper/CyberCity.html
BigBook http://www.bigbook.com/
Virtual Derby http://www.virtual-derby.com/
Virtual LA http://www.gsaup.ucla.edu/bill/LA.html
Virtual Soma http://www.hyperion.com/planet9/vrsoma.htm